> For the complete documentation index, see [llms.txt](https://docs.elastiflow.com/llms.txt). Markdown versions of documentation pages are available by appending `.md` to page URLs; this page is available as [Markdown](https://docs.elastiflow.com/data_platforms/elastic/autoops.md).
# AutoOps for Self-Managed Elasticsearch Clusters
## What is AutoOps and why would I want it?
[AutoOps](https://www.elastic.co/docs/deploy-manage/monitor/autoops) is a cloud hosted tool from Elastic that provides monitoring, alerting, and improvement recommendations. It is free for all users, even those on the free basic license and self hosting their Elasticsearch clusters.
Who will benefit from having AutoOps setup?
* Everyone who needs basic monitoring setup for their Elastic instances, but doesn't want to add a dedicated monitoring cluster or ship metrics / logging back into their Elastiflow ES cluster. More info on how AutoOps compares to stack monitoring can be found [here](https://www.elastic.co/docs/deploy-manage/monitor/autoops-vs-stack-monitoring)
* Users with monitoring in place, but who need recommendations on how to avoid common performance or availability pitfalls
With AutoOps, you can easily get information and capabilities like:
* Indexing and search rates at the node, index, and shard levels
* Resource usage across nodes
* Garbage collection pauses
* Notifications for common issues like hot spotting (higher resource usage / indexing rates on single nodes), disks becoming full, requests being rejected, etc.
What limitations are there?
* Monitoring data is only stored for 10 days
* Fully air-gapped clusters are currently not supported - the AutoOps agent will need to send data to the cloud
* No customization on what metrics are shown or what events are available
* Not available for Elasticsearch versions <= 7.16.X
* Not available for Opensearch users
### Events
Events in AutoOps are a set of conditions to alert on, along with details on what the impact to the cluster may be and recommendations on how to remedy the issue. AutoOps currently includes over 100 events to alert on. Some events of interest include:
* Slow indexing / search performance
* Nodes at low / high / flood stage watermarks
* Cluster rejecting indexing / search requests
Here is an example of the information displayed in a low watermark exceeded event:
When an event is triggered, AutoOps will give information on the specific conditions that were detected, recommendations on how to remedy the event, and potential impacts of the event. All events are prebuilt by Elastic, there is no ability to create custom events.
Some details on the events can be modified, to adjust the alert and resolution conditions. This can be done from the Event Settings page. Not all events are modifiable, so the events listed here will be a subset of all events.
There is no maintained listing of all possible events, but you can view the currently available events when setting up a notification filter
### How do I setup AutoOps?
You'll need to have:
* Elasticsearch 7.17.X+
* A host for the AutoOps agent (we recommend your ElastiFlow collector host)
{% hint style="info" %}
The Elasticsearch cluster doesn't need to be able to communicate with the Elastic cloud service itself, but the AutoOps agent will need to be able to connect both to your ES cluster as well as the cloud service.
{% endhint %}
During setup, you'll need to supply:
* Elasticsearch URL
* Username and password or an [API key](https://www.elastic.co/docs/deploy-manage/api-keys/elasticsearch-api-keys)
* Path to CA certs if using custom TLS certs
Steps:
1. Create an account at [cloud.elastic.co](http://cloud.elastic.co) (no payment info necessary)
2. In the Connected Clusters section of the landing page at [cloud.elastic.co](http://cloud.elastic.co), select "Connect self-managed cluster"
3. Select the "Get started" button under "Just want AutoOps?"
4. Choose your installation method. This guide uses the generic Linux installation path
5. You'll now receive several commands to install the agent:
1. First, you need to either git clone the AutoOps install repository, or download it as a zip file and load it into the host you want to run the AutoOps agent on
2. Next, you should expand the AutoOps connectivity check section, set the necessary environment variables, and run the connectivity check.
1. Troubleshooting issues from the connectivity check is quicker than troubleshooting issues directly on the agent, so it's easier to start from here.
2. Note that you'll need to scroll the export window to see all of the options. There are some commented options that may be necessary to set, in particular the CA cert variable if you're using a custom cert.
3. The username and password variables are marked as optional, but you will not pass the connectivity check if security is enabled in ES and you do not supply these variables
4. More information on the connectivity check and what do if any part fails are at
3. After the connectivity check passes, you should run the install script for the AutoOps agent
1. The environment variables used by the connectivity check are not used by install script, so you can't leave off any flags just because you set that info in a variable
2. Confirm that the installation script output indicates that the agent is installed, and take note of the directory in which it is installed
4. Finally, after you have run the installation script, you can click the "I have run the command button". Elastic will verify that the cloud service is receiving data from the agent
6. If any issues have occurred and no data is sent to the cloud service, you'll receive an error screen recommending the connectivity check and linking a [troubleshooting guide](https://www.elastic.co/docs/deploy-manage/monitor/autoops/cc-cloud-connect-autoops-troubleshooting)
1. The error will indicate "Installation failed", but the actual installation of the agent has likely succeeded, there is just a misconfiguration somewhere preventing data collection by the agent. You can verify that the agent is installed with:
```
sudo elastic-agent status
```
2. For troubleshooting why the agent is not sending data to the cloud, the elastic agent [installation layout](https://www.elastic.co/docs/reference/fleet/installation-layout) will help you find the logs, and the restart command from the [command reference](https://www.elastic.co/docs/reference/fleet/agent-command-reference) will be your friend
3. If you have a custom cert and needed to use the AUTOOPS\_ES\_CA to allow the connectivity check to pass, the agent will have failed to send data to Elastic at this point. [Setting the CA cert on the agent](https://www.elastic.co/docs/deploy-manage/monitor/autoops/autoops-sm-custom-certification) requires updating yaml configs that don't exist until you've installed the agent already.
1. The custom cert docs indicate that you need to add the path to the cert into two modules in elastic-agent.yml, but depending on your version you may have more modules that you will need to specify the CA cert in
2. Note that the environment variable shown in the docs AUTOOPS\_CA\_CERT has a different name than the AUTOOPS\_ES\_CA variable set for the connectivity check, despite being the same cert used for the same purpose. You will either need to export this new variable, or ensure that you use the previously exported AUTOOPS\_ES\_CA variable in the yaml updates instead
4. After you have made any necessary updates in elastic-agent.yaml, restart the agent with
```
sudo elastic-agent restart
```
\
You can then hit the "Try again" button in the installation wizard
5. If you continue to have any issues with data getting to the cloud, check the logs.
1. If the errors have something like ... can not convert 'object' into 'string' ... ssl.certificate\_authorities ... but you've already verified that the YAML formatting looks correct on your new CA cert paths, grab a [diagnostic](https://www.elastic.co/docs/reference/fleet/agent-command-reference#elastic-agent-diagnostics-command) and review the environment.yaml file to ensure that your AUTOOPS\_CA\_CERT variable is being correctly captured by the agent
6. After data is successfully being sent to the cloud, when you click "Try again" you'll be taken to the AutoOps page for your cluster, and your installation is complete
With the agent installation and setup complete, the agent will be grabbing metric data from your cluster every 10 seconds. You can now click into the AutoOps page for your connected cluster at [cloud.elastic.co](https://cloud.elastic.co), and view this metric data.
Any events that are triggered by AutoOps will now be visible on the Overview and Cluster pages. If you want to be notified about these events, you can continue on to setup notifications.
### Setting up notifications
In order to get alerts based on the monitoring data, you'll need to first set up one or more connectors and notification filters.
* **Connectors** define methods of notifying your users, such as email, Slack, PagerDuty, etc.
* **Notification filters** will specify the events to notify on, the clusters you want these notifications from, and which connectors to send notifications on
Here are the steps you will follow:
1. Set up a connector at **Notification Settings > Connector Settings**
2. Set up a notification filter at **Notification Settings > Filter Settings**
{% hint style="info" %}
Filters are not solely for removing events from notification, they are a required piece to attach a connector with a cluster. Without a notification filter, no notifications will be sent
{% endhint %}
3. Once you have a Notification Filter successfully set up, you will begin receiving alerts whenever an included event is triggered in your cluster
Example Slack notification:
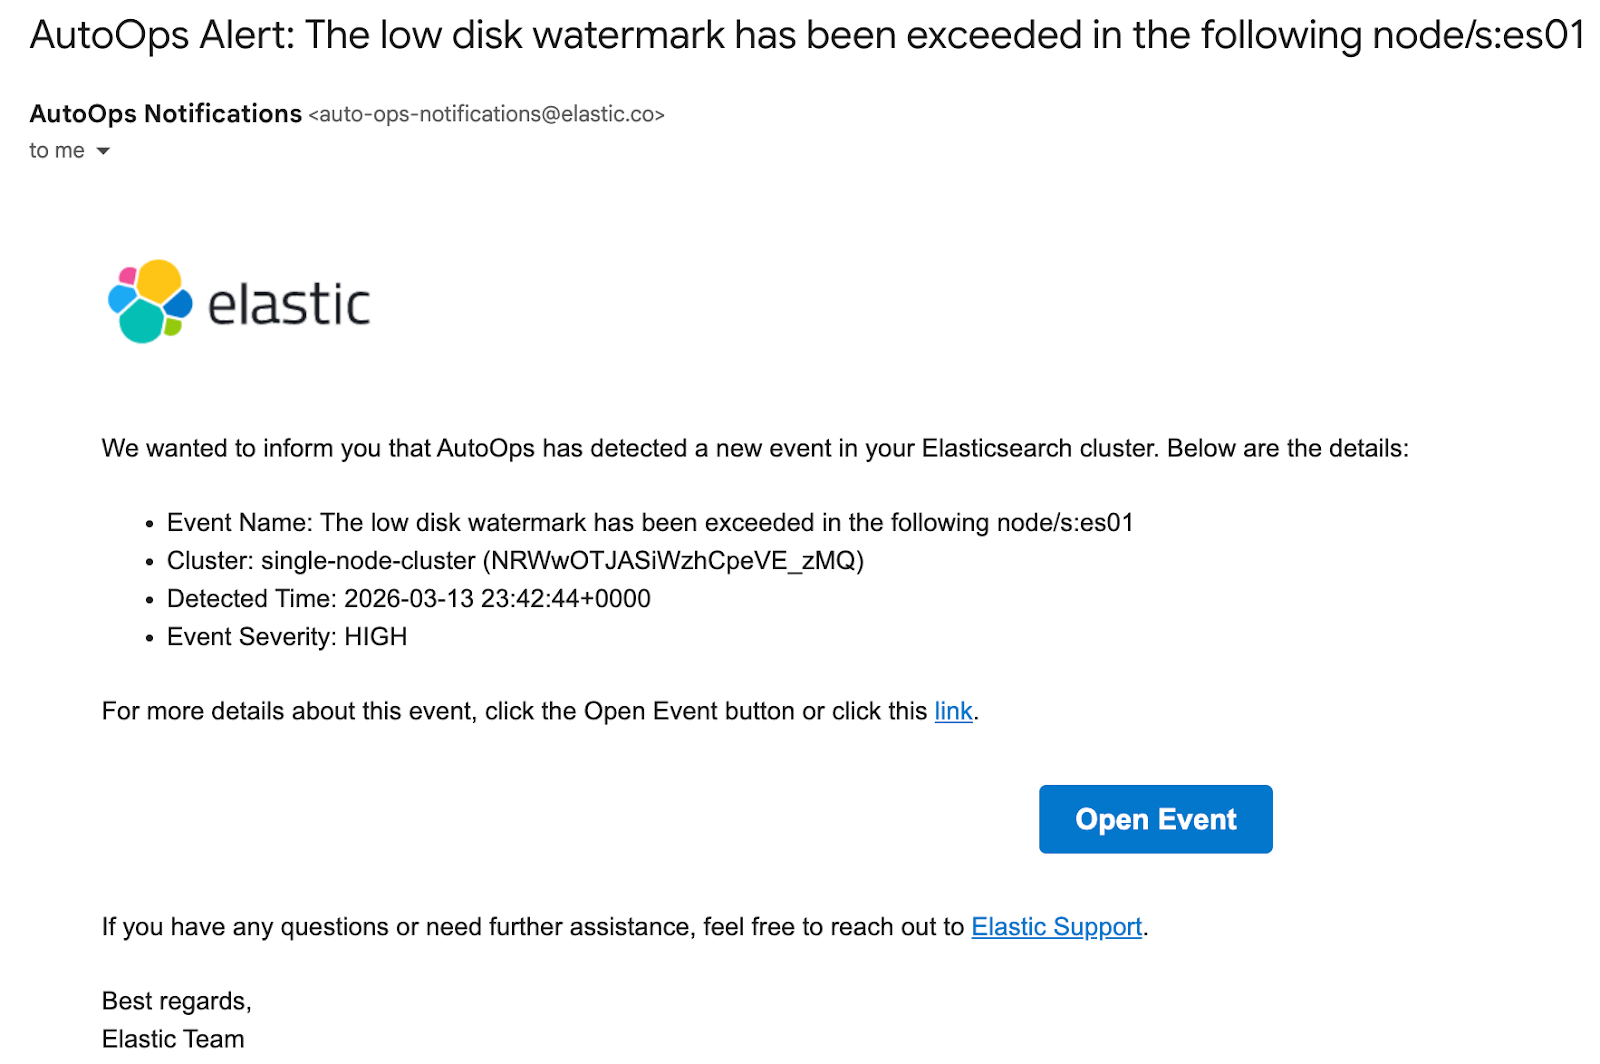
Example email notification:
---
# Agent Instructions
This documentation is published with GitBook. GitBook is the documentation platform designed so that both humans and AI agents can read, navigate, and reason over technical content effectively. Learn more at gitbook.com.
## Querying This Documentation
If you need additional information that is not directly available in this page, you can query the documentation by asking a question.
Perform an HTTP GET request on the following URL with the `ask` and `goal` query parameters:
```
GET https://docs.elastiflow.com/data_platforms/elastic/autoops.md?ask=&goal=
```
`ask` is the immediate question: it should be specific, self-contained, and written in natural language.
`goal` is what the user is ultimately trying to achieve, the reason they need the answer. Sharing it helps GitBook give you a better, more relevant answer. A goal is most helpful when it describes the outcome the user wants rather than restating the question. For example, with `ask=how do I create an API token`, a goal like `automate deployments from our CI pipeline` lets GitBook tailor the answer to that use case.
The response will contain a direct answer to the question and relevant excerpts and sources from the documentation.
Use this mechanism when the answer is not explicitly present in the current page, you need clarification or additional context, or you want to retrieve related documentation sections.